Narrate overview—IVE
Related information
 Related topics
You can capture important information in one, or more visualization insights and build a story that can be shared with colleagues. For example, you might discover important trends in the data that you want to present to a client. You build stories about your data using the Interactive Visual Explorer (IVE) Narrate feature.
Navigate the narrate workspace
The Narrate workspace in IVE allows you to create presentations from your visualizations. You can then use the presentations in live events, or export them to files that can be shared.
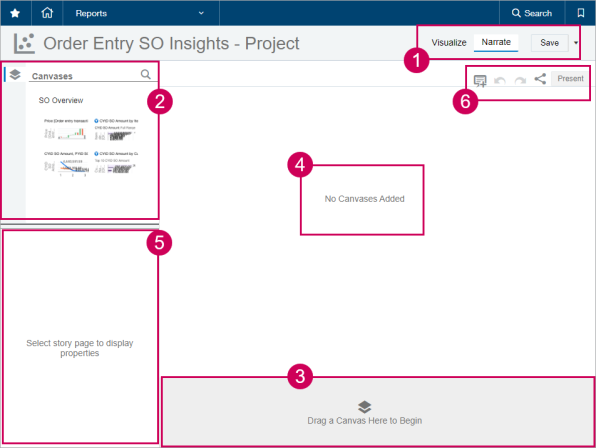
- Narrate: You get to the Narrate workspace by selecting Narrate at the top of the IVE page.
- Canvases: This area of the Narrate workspace holds the canvases you created in the Visualize workspace. Each canvas you create is listed here and available to use.
- Slides: Drag and drop canvases to the Slides area to create a narrative for your data. You can select between the slides at the bottom of the page to interact with the visualizations on the slides.
- Slide display: Canvases are displayed in this area after you add a canvas to the Slides area. You can manipulate your visualizations to present just the data that's needed.
- Properties: Adjust the properties of your slides and visualizations.
- Comment or share: After you craft the story for your data, you can share the story. You can present the slides live, or export them to the file type of your choice for use in other mediums.
For a detailed explanation of the IVE workspace, see Navigate Interactive Visual Explorer.
Regional availability
Interactive Visual Explorer (IVE) is generally available in:
All regions
